On my way to work one morning, I noticed that few pedestrians were using the main road through the residential complex. That raised a question: when do residents generally leave home? To investigate, I started a computer-vision object-detection experiment and tried to test my everyday observation with data.
System Architecture and Model Selection
Hardware Configuration
- Raspberry Pi + HQ Camera(IMX477R module)
- 25mm prime lens (approximately 138mm full-frame equivalent focal length)
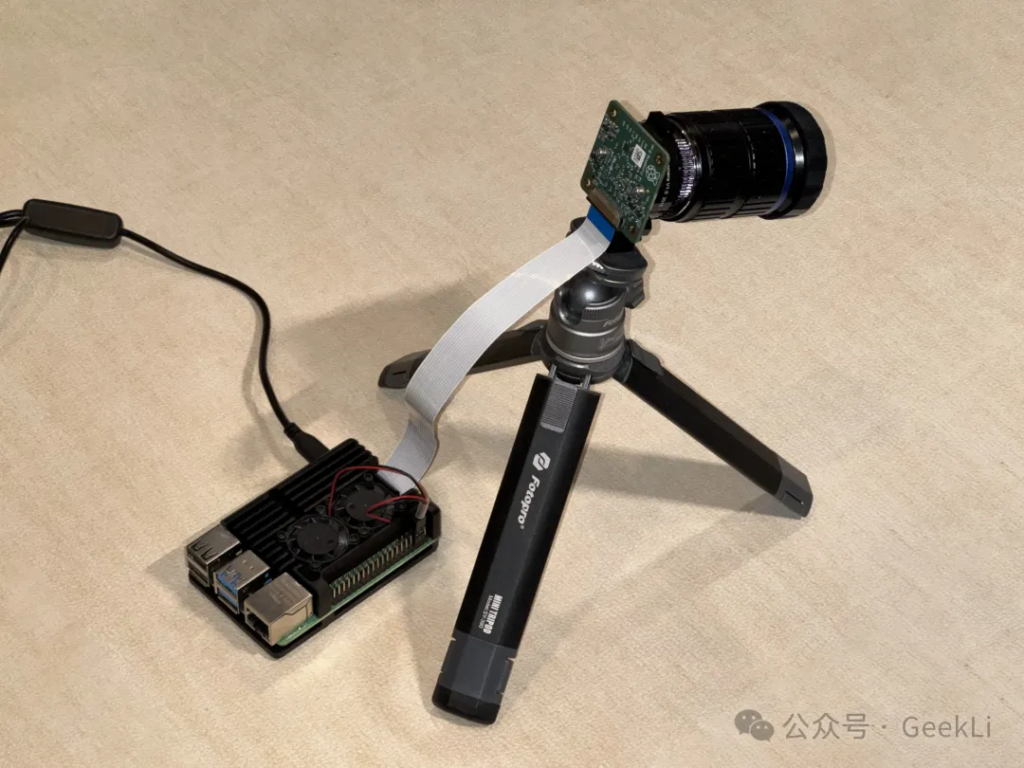
The equipment was mounted on a windowsill and took photographs covering the main road through the complex at 10-second intervals. Images were saved in JPEG format.
Detection Targets and Model Comparison
During model selection, I first tried multimodal vision-language models (Vision-Language Models, VLMs), including the active open-source projects LLAVA 1.6 and LLAMA3.2-Vision. Prompt engineering produced structured JSON output. However, when run locally on a Mac mini (M2), these large models were far slower than real-time requirements, consumed substantial resources, and were inefficient to deploy, so I ultimately abandoned them.
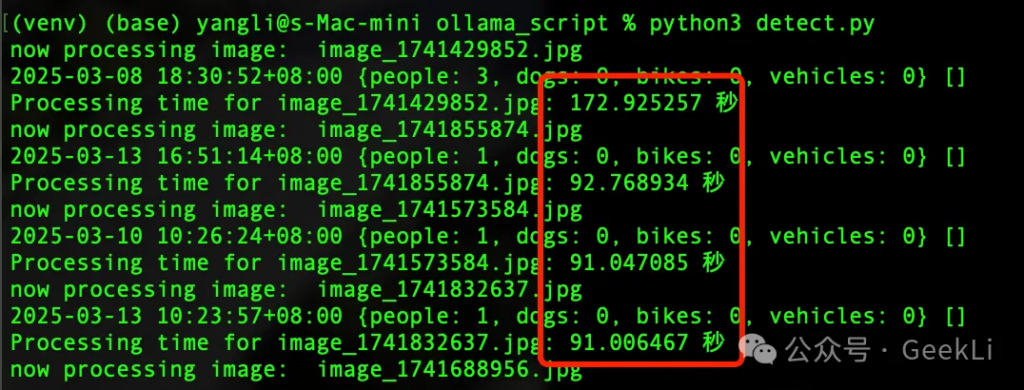
Balancing performance and accuracy led me back to the YOLO family. I chose YOLOv12x for object detection because it offers a good compromise between accuracy and speed.
At first, detection was limited to pedestrians (the person class). Later, I added dogs (the dog class) and bicycles (the bicycle class), making full use of YOLO’s strengths in general-purpose object detection.
Data Sampling and Inference Pipeline
Because the Raspberry Pi itself has limited computing power and cannot run YOLOv12x directly, I built a LAN-based inference backend service:
- On the Raspberry Pi, libcamera-still captures images, while crontab and scp transfer them over Wi-Fi to a local Mac mini in real time; filenames contain timestamps;
- On the Mac, PIL crops each image, retaining only the region containing part of the main road;
- YOLOv12x performs inference on each image and outputs detections for three classes (
person,dog, andbicycle); - The extracted timestamps are combined with the results, which are written to a database for subsequent statistical and visual analysis.
Data Storage Structure and Processing Logic
This experiment uses the lightweight SQLite database for local storage for the following reasons:
- It requires no independent server process, making it suitable for edge-computing scenarios;
- Its table structure is flexible, enabling rapid design iteration;
- It supports standard SQL query syntax, making aggregation, export, and visualization integration convenient.
- It can be conveniently imported into Superset for visual analysis.
Workflow Overview
- Images are sent to the inference model for detection;
- The image filename is written to the
countstable to record the raw information; - The count for each target class is updated in the corresponding row, completing the structured annotation.
Core Code Implementation
def detect_objects(image_name):
    results = model([image_name], imgsz=1024, conf=0.4, verbose=False)
    for result in results:
        result_json = result.to_json()
        name_counts = count_name_values(result_json)
        c.execute('INSERT INTO counts (image_name) VALUES (?)', (image_name,))
        count_id = c.lastrowid
        for name, count in name_counts.items():
            c.execute(f'UPDATE counts SET "{name}" = ? WHERE id = ?', (count, count_id))
        conn.commit()
    return name_counts
images_dir = "images"
jpg_list = [f for f in os.listdir(images_dir) if f.endswith('.jpg')]
for jpg in tqdm(jpg_list, desc="Processing images"):
    detect_objects(jpg)
conn.close()
Statistical Findings
Aggregating nearly one week of sample data produced the following preliminary conclusions:
- On weekdays, 8:00–9:00 and 17:00–19:00 are peak periods for pedestrians;
- Pedestrians are distributed more evenly on weekends, with peaks around 10:00 and 17:00 and a low between 12:00 and 13:00 (only about 4% of the total);
- Dog walking is concentrated around 8:00 on weekdays, while it occurs throughout the day on weekends, with a higher overall count;
- Cycling is especially active on weekends and shows a clear upward trend.
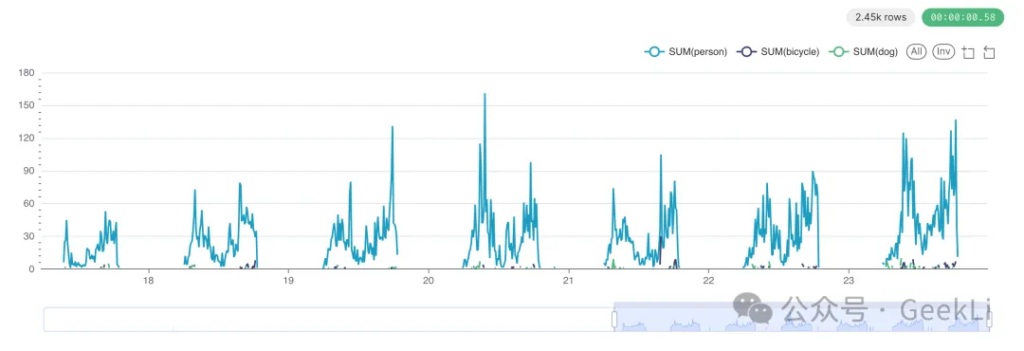
Line chart of one week of data
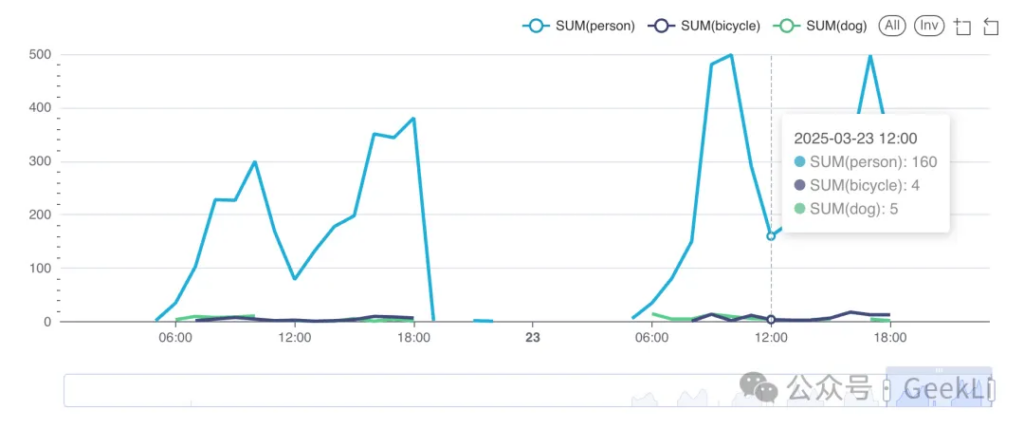
Every-10-minute counts on Saturday and Sunday
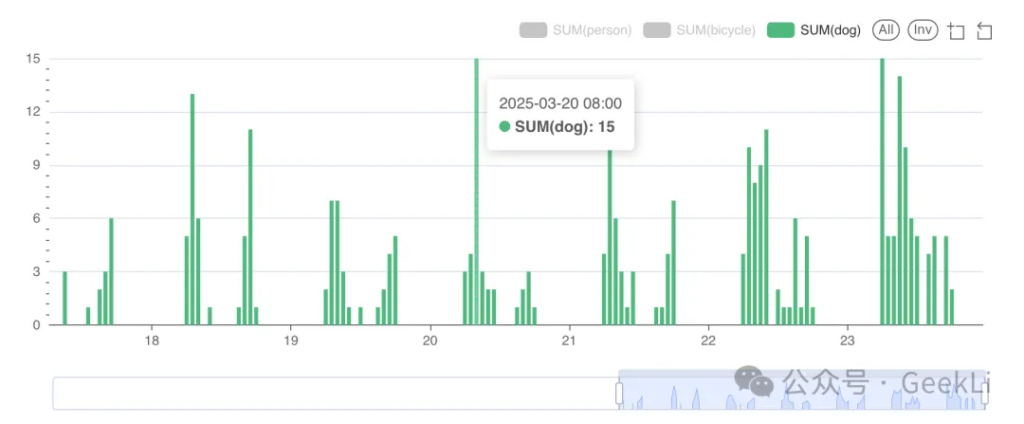
Total dogs per 10-minute interval over one week
Experiment Summary
This project provides an initial validation of the feasibility of using lightweight hardware and local inference with YOLOv12x to detect target traffic on a residential complex’s main road:
- The system runs stably, and the entire data-collection and processing workflow is automated;
- It distinguishes three target types—people, dogs, and bicycles—with acceptable recognition accuracy in daylight;
- The logs have accumulated more than 14,000 records, supporting analysis of behavioral patterns.
The main technical bottlenecks remain:
- It cannot handle low-light scenes;
- Repeated counting causes errors;
- Targets are small and lack sufficient features to support more complex behavior recognition.
Technical Challenges and Practical Constraints
Insufficient Nighttime Illumination
The model performs well in natural light, but nighttime illumination is insufficient; even at high ISO, the HQ Camera cannot capture clear targets.
Duplicate Counting Across Frames
During continuous shooting, a target may be recognized repeatedly across multiple frames. Because targets are small in the images, features cannot be extracted effectively for ReID (re-identification), and simple clustering or temporal inference cannot remove duplicates accurately. Manual sample checks show that the model’s count is roughly twice the actual number, making duplicate counting a significant problem.
As an experimental project driven by curiosity about the real world, this system has essentially met its initial validation goals. The project is open source: https://github.com/li-yang-cn/RaspberryPi-YOLO-Object-Detection (the code implementation differs in some respects from this article).
If you are interested in this kind of “low-cost behavior observation system,” I welcome discussion.